Gyuhyeok Park
← Selected workProject #2
QUANTITATIVE RESEARCH

ICAIF 2026

Team project · scheduling & quantitative research

Look beyond the algorithm.

COMPOSITE RANK / RESEARCHQ18 · Q19 · Q21 · Q22 · Q23
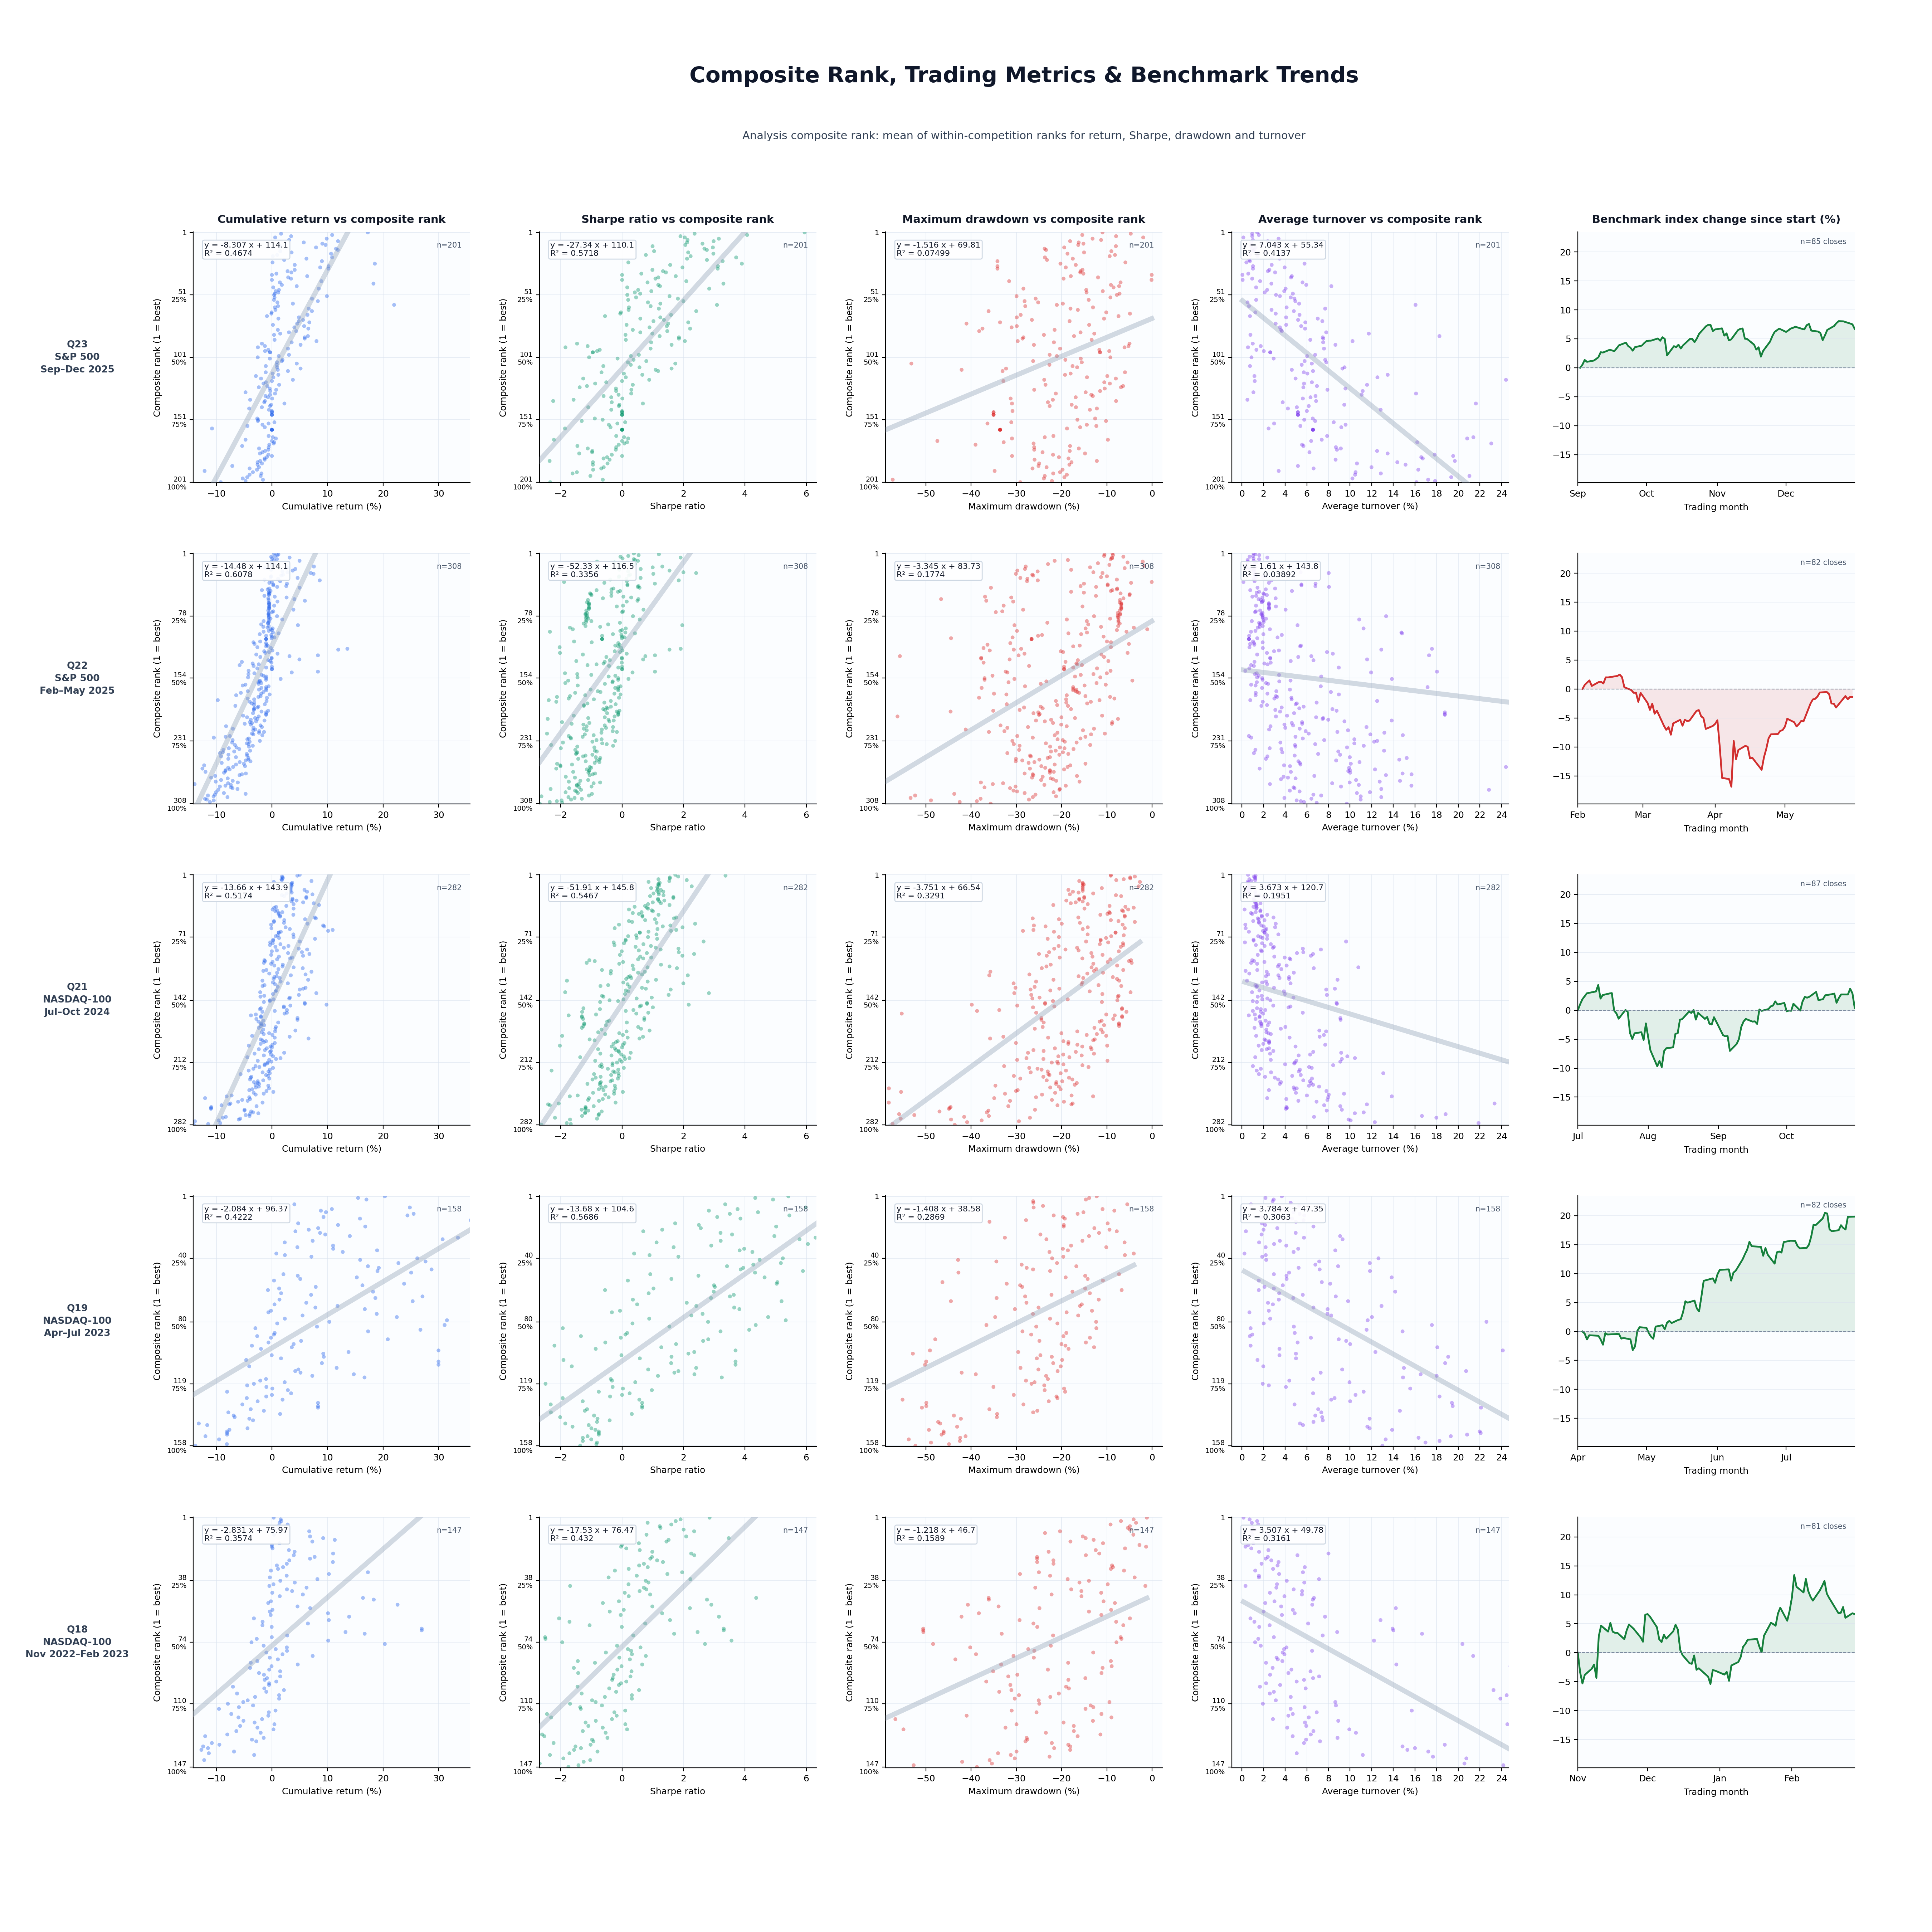
Four trading metrics versus analytical composite rank across five historical contests
PAIR TRADING V5 / FOCLOCAL REPLAY
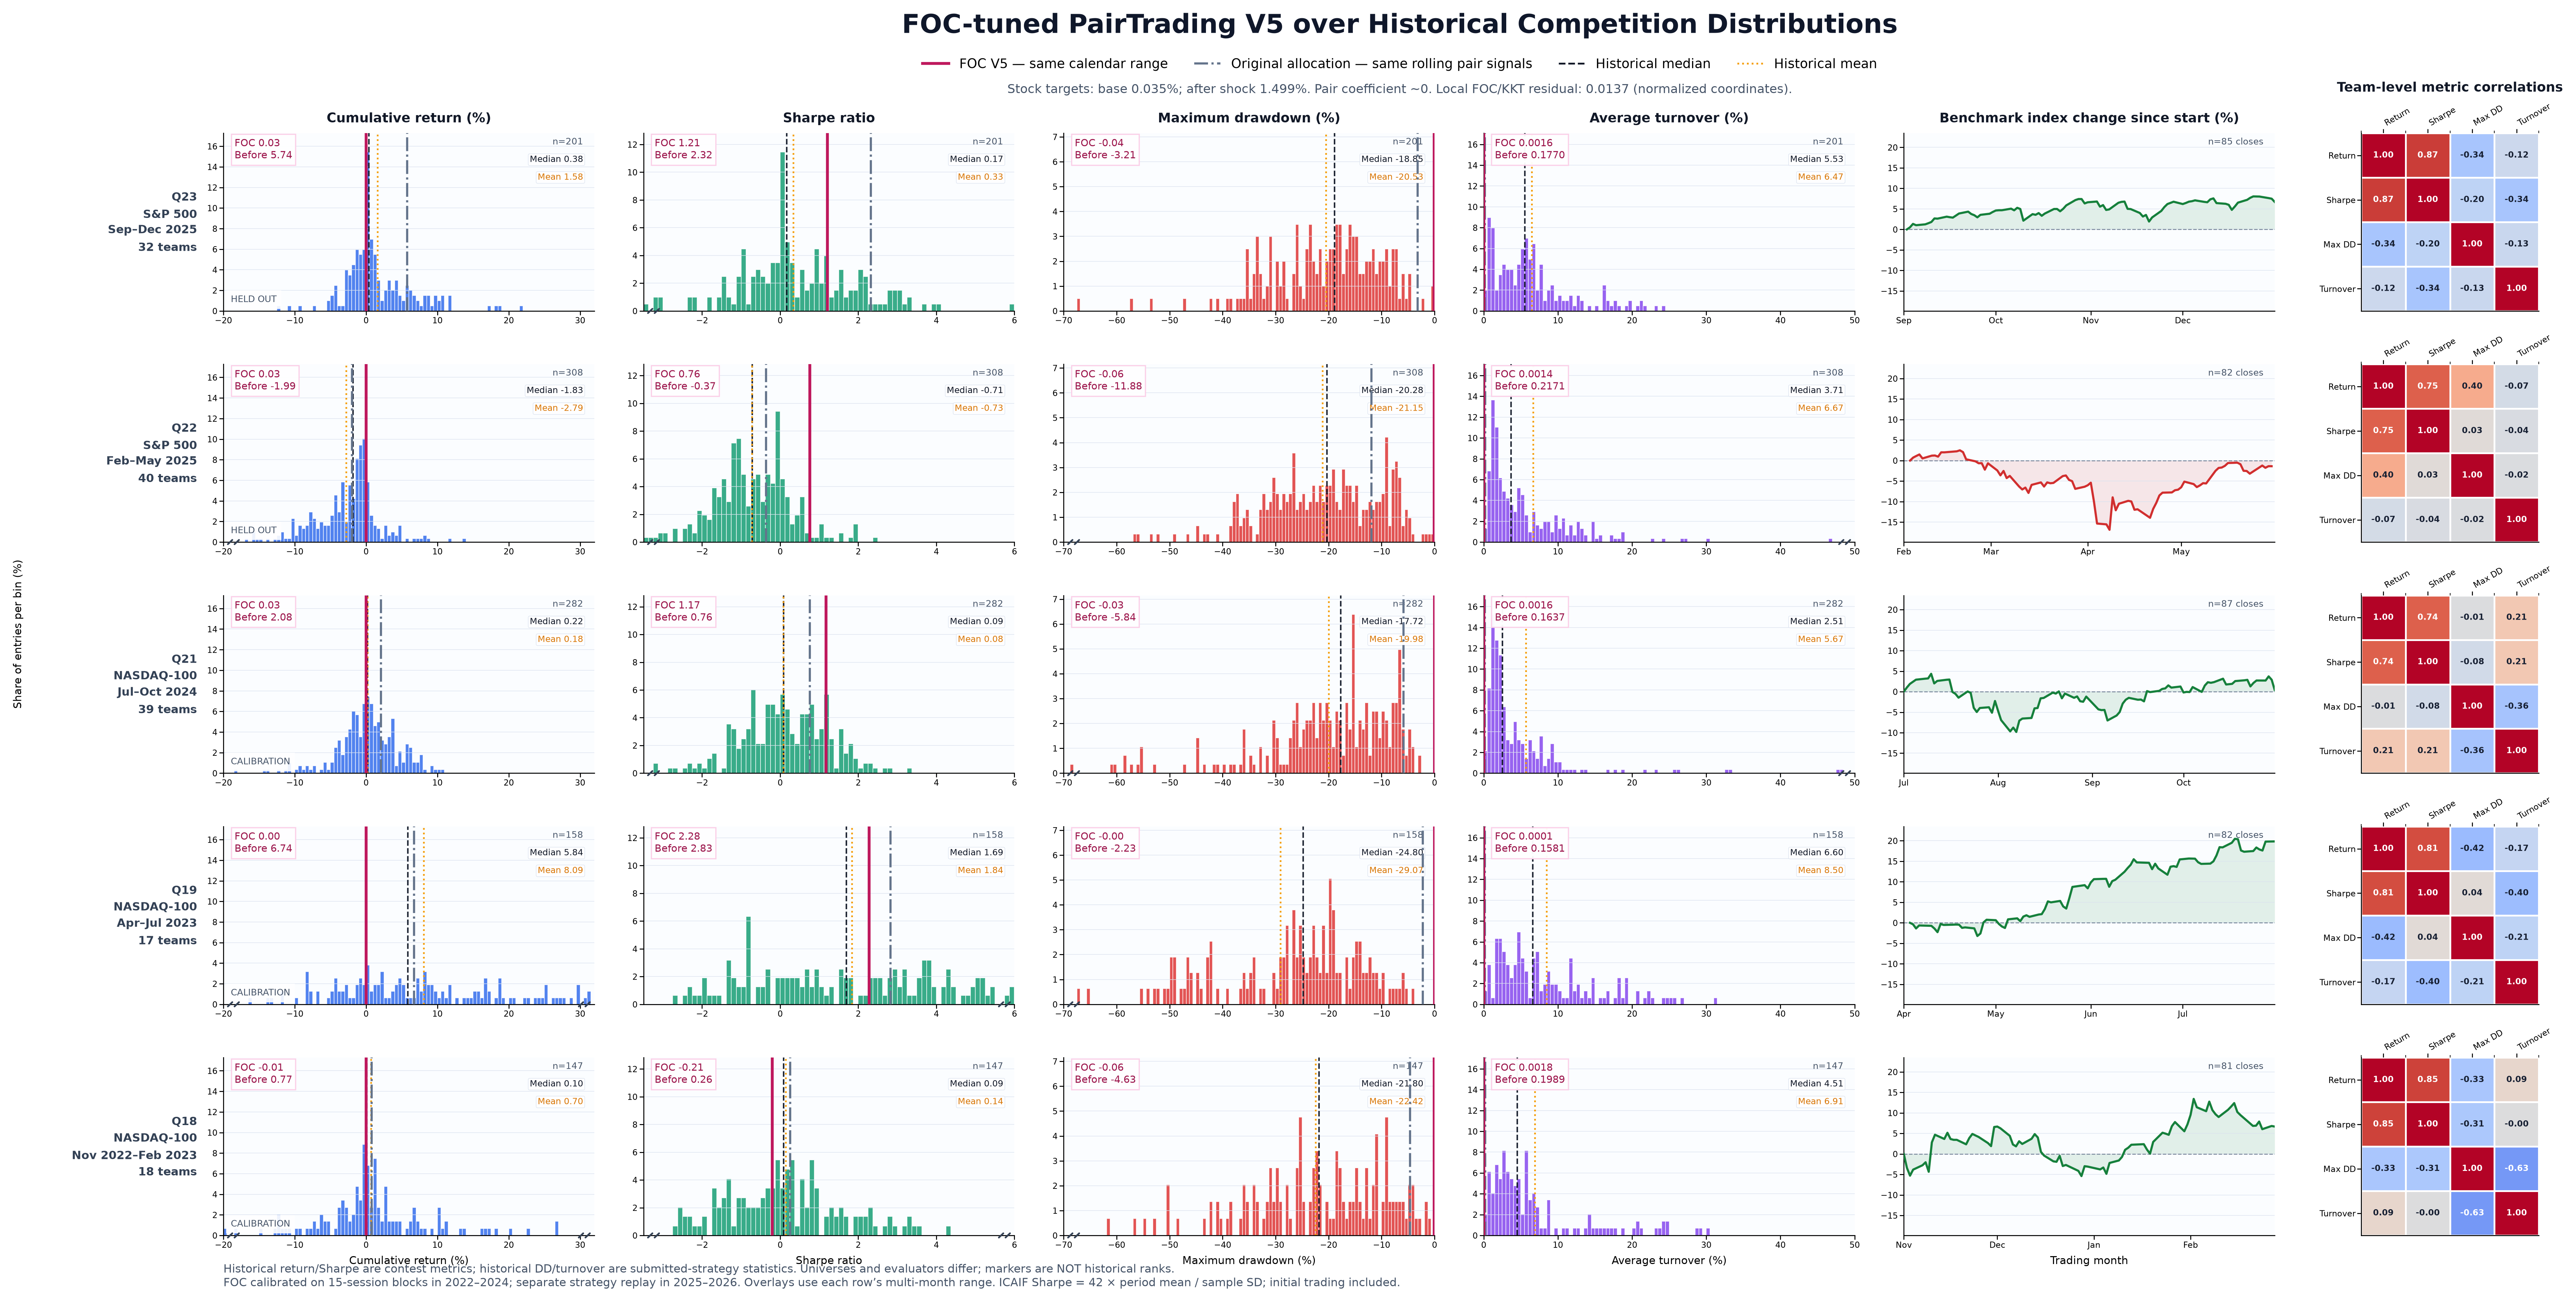
FOC-tuned V5 local replay over historical competition distributions
Working backward from results
to competition conditions

Research artifact · five previous Quantiacs competitions, not official ICAIF results

01

Start with the evaluation, then design the strategy

This is a team project. My contributions include organizing submission schedules in Korea Standard Time, examining the evaluation rules, and quantitatively analysing previous competitions to inform strategy discussions. I approached the work from the distributions of evaluation metrics, rather than repeatedly modifying an algorithm after seeing a single return figure.

The ICAIF rules describe four objectives: cumulative return, Sharpe ratio, maximum drawdown, and turnover. Their ranks are averaged. A gain in return can therefore be offset by a worse risk or trading-efficiency rank. The research asks where improving one metric stops being worth the deterioration in another.

02

Five historical competitions, four comparable metrics

I examined completed Quantiacs seasons Q18, Q19, Q21, Q22, and Q23 from 2022–2025. The analysis preserves the public return, Sharpe, drawdown, and turnover values and compares each season separately. Q22 and Q23 use S&P 500 equities; the earlier selected seasons use NASDAQ-100 equities.

The first figure plots the four metrics against an analytical composite rank and places benchmark market movement alongside them. That composite is the mean of within-competition metric ranks, not Quantiacs' official award ranking. The historical seasons' official ranking uses contest-period out-of-sample Sharpe.

Composite rank and trading metrics · open full-size chart
03

What can—and cannot—be transferred

The ICAIF setup uses 15 trading days and 105 decision rounds, with 30 US stocks, long-only positions, and a 30% per-stock weight limit. The historical Quantiacs contests run for four months and permit long–short strategies. Similar metric names do not make their horizons, portfolios, or formulas identical.

The historical distributions are useful context for relative trade-offs. They are not a conversion of four-month performance into a 15-day forecast. Drawdown signs, turnover units, and the distinction between contest results and submitted-strategy statistics must remain explicit when interpreting the charts.

04

FOC/KKT: balance marginal changes in expected rank

Actual ranks change in steps. The FOC research smooths expected ranks against fixed comparison strategies, gives the four metrics equal weight, and searches for a point where marginal improvements and losses balance. At parameter boundaries it checks KKT direction conditions. Historical metric distributions are standardized by median and IQR with equal weight per contest.

The search varies baseline exposure, additional exposure after a drop, momentum blending, the pair signal coefficient, tilt, and the trading band. It uses multiple initializations and local refinement. The resulting projected derivative residual is approximately 0.0137; this is a numerical approximation rather than a proof of a global optimum.

05

Rank improvement and the exposure trade-off

The FOC study selects parameters on 46 windows from 2022–2024 and separately evaluates performance on 27 windows from 2025–2026. In a fixed local comparison group, the mean integer-rank score moves from 3.037 to 2.620, where lower is better. Return rank worsens from 3.074 to 3.444, while drawdown and turnover ranks move from 3 to 2.

The tuned pair coefficient is effectively zero and exposure becomes strongly cash-oriented. The result supports a discussion about the scoring trade-off; it does not show that a 500-stock pair alpha became more profitable. Neither this local comparison nor the chart overlays are official ICAIF competition results.

FOC-tuned V5 · local replay, not official results · open full-size chart
06

Make the simulation inspectable

The research keeps selection and evaluation periods separate, uses data available before each decision, and compares allocation rules on the same rolling pair signals. The execution ledger includes an initial purchase, a 0.1% transaction cost, and post-fee NAV-based target weights. Missing-price windows are excluded and recorded.

Checks include agreement between the actual strategy file and the research ledger and invariance to large changes in future prices. Hourly bars proxy execution prices; cash interest, dividends, and complete delisting history are outside this local setup. The second chart overlays a local replay on historical distributions over the same calendar ranges.

NEXT PROJECTFinding a place to belong↗